

In enterprise organizations, millions of dollars are invested annually into digital transformation, content production, engineering resources, and search engine optimization. Yet, when Chief Marketing Officers (CMOs) and Vice Presidents of Marketing sit down with the Chief Financial Officer (CFO) or the Board of Directors, a dangerous communication breakdown frequently occurs.
Technical SEO teams present dense 50-slide decks filled with keyword ranking movements, impression counts, crawl error logs, and gross pageviews. Meanwhile, executive decision-makers are asking fundamental commercial questions: How much net-new pipeline did organic search generate this quarter? How does our organic customer acquisition cost (CAC) compare to paid search? Are we capturing market share from our primary competitors, or are we losing ground?
When enterprise SEO reporting remains trapped in operational vanity metrics, leadership views organic search merely as a cost center rather than a predictable, high-yield revenue engine. To secure long-term executive buy-in and scale budget allocations, marketing leaders must bridge the chasm between technical search mechanics and boardroom financial metrics.
In this comprehensive master guide, we demystify enterprise SEO metrics in plain English: the four-tier measurement architecture every large organization needs, how to separate vanity numbers from revenue drivers, how to track multi-touch organic attribution across complex sales cycles, and a step-by-step roadmap to build an executive reporting dashboard that wins boardroom approval.
- Organic Search Generates 53.3% of All Website Traffic: Comprehensive cross-industry research conducted by BrightEdge reveals that organic search continues to dominate as the single largest traffic driver across B2B, technology, and ecommerce sectors, delivering over 53.3% of total measurable web traffic.
- Enterprise B2B Buyers Conduct 12 Searches Before Engaging a Brand: A landmark digital purchase path study published by Google and Millward Brown Digital confirmed that enterprise decision-makers perform an average of 12 distinct search queries prior to visiting a specific vendor’s website or requesting a sales demo.
- Inbound Organic Leads Cost 61% Less Than Outbound Acquisition: Extensive marketing benchmark data compiled by HubSpot demonstrates that inbound organic leads cost 61% less to acquire on average than outbound sales initiatives and convert at a 14.6% close rate compared to just 1.7% for outbound channels.
- Compounding Enterprise SEO Yields 5.3x to 12.2x Total ROI: A Total Economic Impact (TEI) study conducted by Conductor and Forrester Consulting revealed that structured enterprise SEO initiatives deliver between 5.3x and 12.2x ROI over a 3-year compounding lifecycle due to zero ongoing media cost once organic authority is established.
- 74% of Enterprise Marketing Leaders Struggle with Attribution: Research from Gartner indicates that 74% of CMOs and marketing directors identify multi-touch revenue attribution as their greatest reporting obstacle when justifying organic search budgets to corporate finance leaders.
The 3 Reporting Audiences in an Enterprise Organization
The first rule of effective enterprise reporting is audience calibration. Presenting the exact same dashboard to software engineers, content writers, and the Chief Financial Officer is a recipe for failure. An enterprise organization requires three distinct tiers of reporting:
| Reporting Tier | Target Audience | Primary Focus & Cadence | Key Metrics Monitored |
|---|---|---|---|
| Tier 1: Operational / Technical | Engineering, Web Dev & Technical SEOs | Infrastructure health & crawl diagnostic telemetry (Weekly) | Indexation ratio, Core Web Vitals, server log hit frequency, 404/500 errors |
| Tier 2: Tactical / Growth | Content Strategists, Product Marketers & SEO Leads | Search visibility, traffic trends & mid-funnel engagement (Monthly) | Non-brand Share of Voice, Top-3 keyword velocity, CTR, reading dwell time |
| Tier 3: Strategic / Executive | CMO, VP of Marketing, CFO & Board | Pipeline generation, CAC efficiency & bottom-line revenue (Quarterly) | Organic Qualified Pipeline ($ ARR), CAC Payback compression, Closed-Won ARR |
When each stakeholder receives the exact data layer relevant to their operational responsibilities, technical bottlenecks get resolved swiftly by engineers, editorial teams produce higher-converting content, and executive leadership clearly sees the commercial ROI of ongoing search investments.
Visual Architecture: The Enterprise SEO Measurement Framework
To visualize how technical crawl health, organic search visibility, and user engagement systematically translate into qualified pipeline and revenue ROI, examine the four-tier architectural framework below:
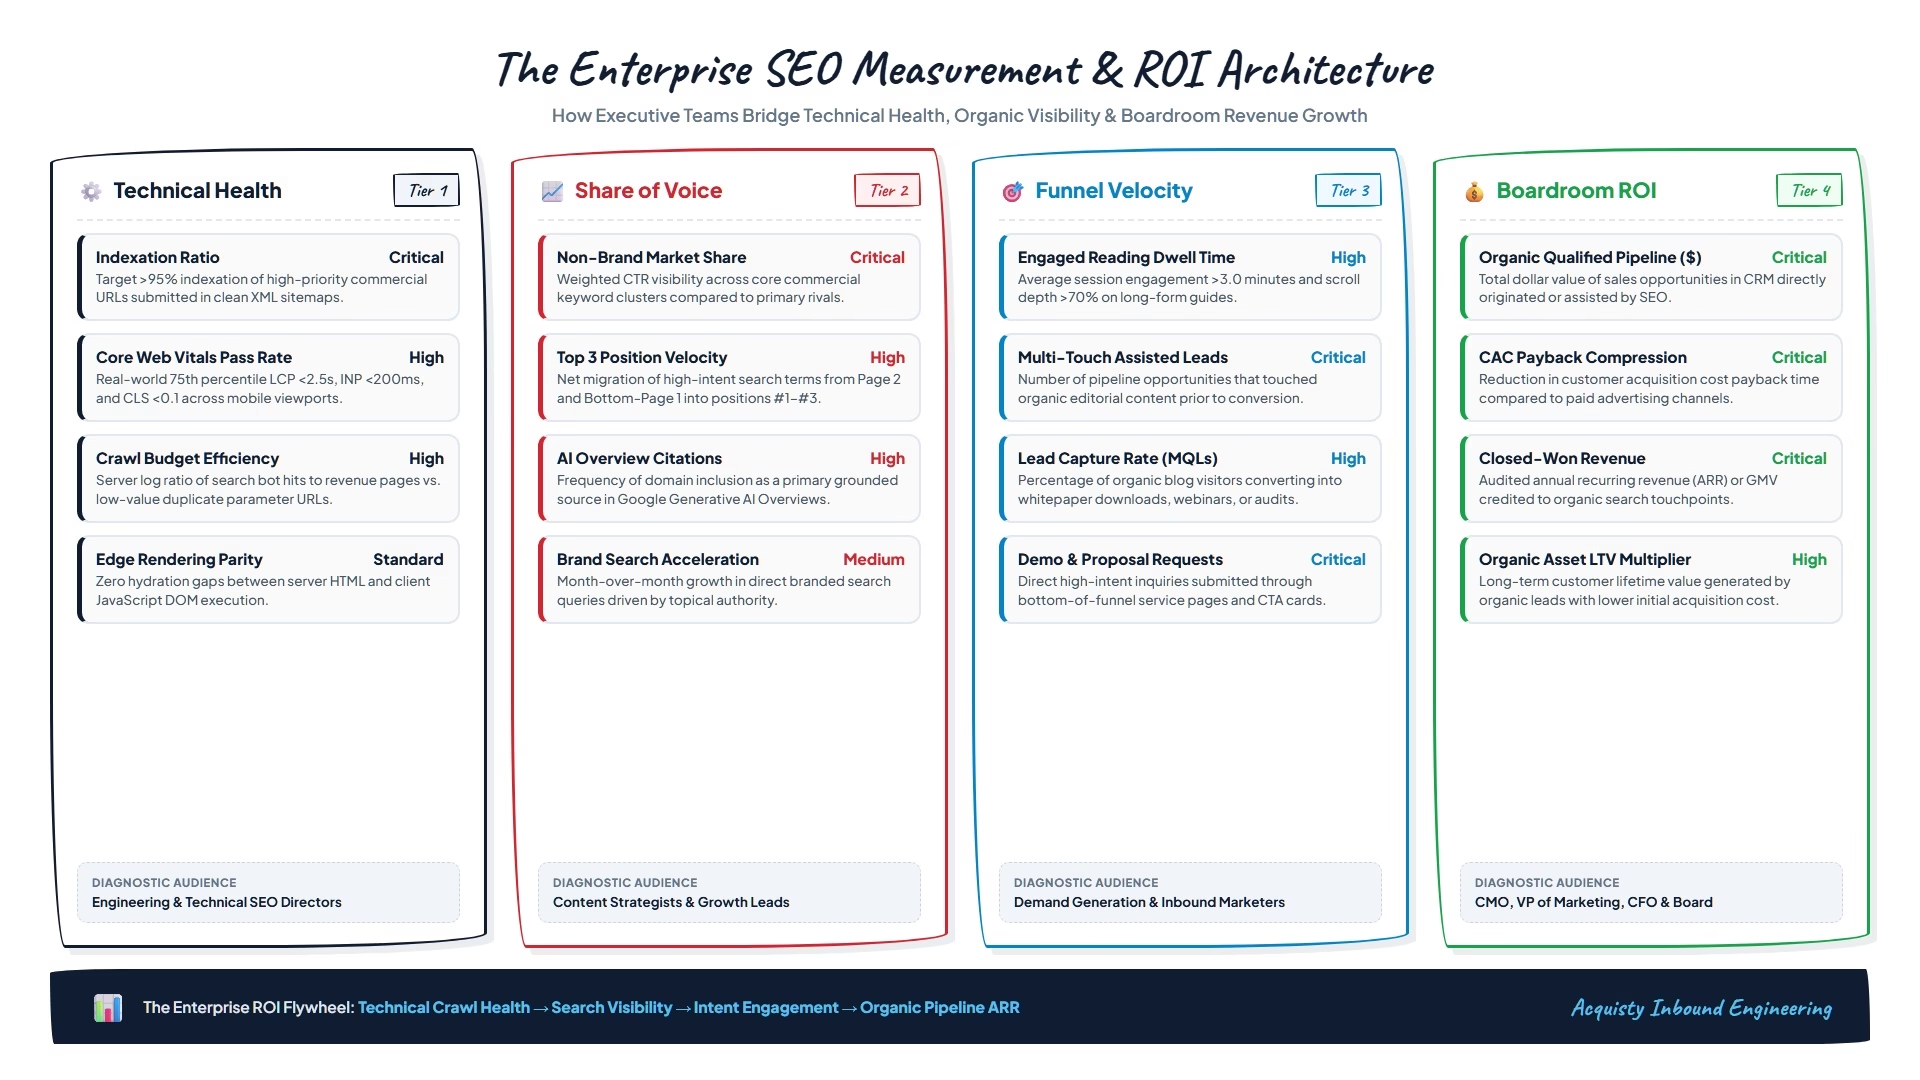
Tier 1: Technical Infrastructure & Crawl Health Telemetry
For websites containing tens of thousands or millions of pages, technical health is not a one-time audit; it is a live infrastructure telemetry system. If search engine crawlers encounter rendering hurdles or waste crawl budget on low-value pages, high-margin commercial content cannot rank. Enterprise technical teams must monitor these four core metrics:
1. Indexation Ratio:
Calculated as the percentage of submitted XML sitemap URLs that are successfully indexed by Google: (Indexed Pages / Submitted Pages) * 100. In a healthy enterprise architecture, this ratio should consistently exceed 95%. A declining ratio indicates that search crawlers are finding low-quality, duplicate, or thin content and dropping pages from the index.
2. Core Web Vitals Field Pass Rate:
Google tests real-world user speed via Chrome User Experience Report (CrUX) field data. Enterprise sites must track the percentage of mobile and desktop pageviews meeting official Google thresholds:
- Largest Contentful Paint (LCP): Main content loads within 2.5 seconds for ≥75% of visitors.
- Interaction to Next Paint (INP): Page UI responds to clicks and taps within 200 milliseconds.
- Cumulative Layout Shift (CLS): Visual layout movement remains below 0.1.
Failing Core Web Vitals directly suppresses organic rankings and spikes user bounce rates.
3. Crawl Budget Efficiency & Server Log Ratio:
Search bot crawlers have finite resources. Analyzing web server logs reveals how Googlebot distributes its crawl capacity across your domain. Track the ratio of search bot requests hitting revenue-generating pages (product catalog, pillar articles, service solutions) versus non-canonical URLs, faceted filter parameters, or 404 error URLs. If more than 20% of crawler hits target low-value URLs, your crawl architecture requires immediate governance.
4. Edge Rendering Parity & Hydration Gaps:
Modern enterprise websites frequently utilize JavaScript frameworks like Next.js, Nuxt, or Angular. If client-side JavaScript execution fails to hydrate correctly for search crawlers, bots see a blank or incomplete page. Track rendering parity between raw server-side HTML and client-side DOM execution to eliminate indexation failures.
Operational Crawl Audit Workflow for Engineering Teams:
To maintain pristine technical health across large-scale domains, technical leads should execute this monthly review:
- Pull 30-Day Server Access Logs: Filter requests by verified Googlebot user-agents and IP blocks to quantify total daily request volume.
- Segment by Page Type: Categorize hits into core commercial solutions, blog guides, faceted parameter URLs, and static assets.
- Identify Crawl Waste Traps: Pinpoint infinite URL loops caused by sorting filters, search result pages, or missing self-referential canonical tags.
- Deploy Edge Caching & Pre-Rendering: Utilize server-side caching (via Cloudflare or Akamai) to serve static HTML snapshots to crawlers in under 200ms, maximizing total pages crawled per bot visit.
To inspect and optimize your website’s crawl architecture, review our production-grade technical SEO services.
📖 Recommended Reading
Website SEO Audit: The Step-by-Step Guide to Finding & Fixing Search Issues That Hurt Your Traffic — Learn how to run a complete diagnostic audit on your website to uncover crawl errors, improve site speed, boost organic rankings, and turn lost visitors into customers.
Tier 2: Search Visibility & Share of Voice (SoV)
Tracking aggregate organic traffic without segmentation is one of the most misleading practices in enterprise marketing. If branded search queries spike because your company launched a major PR campaign or Super Bowl ad, overall organic traffic will rise even if your commercial SEO performance is declining. Tier 2 metrics separate real search equity from outside noise:
1. Non-Brand Organic Traffic vs. Branded Traffic:
Branded search (people searching your exact company or software name) indicates existing market awareness. Non-brand search (people searching for commercial solutions without mentioning your brand) indicates net-new customer acquisition. Enterprise dashboards must isolate non-brand organic clicks to prove whether search campaigns are actually expanding your market footprint.
2. Weighted Share of Voice (SoV):
Rather than checking whether you rank #1 for a single keyword, Share of Voice measures your total organic market share across an entire topical cluster of hundreds of commercial queries. Each ranking position is weighted by its expected click-through rate (CTR):
- Position #1 = ~39.8% CTR weight
- Position #2 = ~18.7% CTR weight
- Position #3 = ~10.2% CTR weight
- Positions #4–#10 = ~1.5% to 7% CTR weight
Comparing your weighted SoV against your primary industry rivals reveals whether you are capturing search market share or ceding ground to competitors.
How to Calculate Enterprise Share of Voice:
Suppose you track a strategic cluster of 100 enterprise software keywords with a combined monthly search volume of 50,000 queries. If your rankings across these terms yield an estimated 12,500 monthly clicks, your organic Share of Voice is 25.0%. If Competitor A earns 18,000 clicks (36.0% SoV) and Competitor B earns 8,000 clicks (16.0% SoV), you immediately understand your exact competitive positioning in that vertical market.
3. Top-3 Keyword Migration Velocity:
Moving from position #25 to position #12 represents great SEO progress, but it produces almost zero traffic because searchers rarely click beyond page one. Track the velocity of high-intent keywords migrating from Page 2 into bottom-of-page-1, and from positions #4–#10 into the top 3 positions where 68%+ of all clicks occur.
4. AI Overview & Generative Engine Ingestion:
With Google rolling out AI Overviews across global search results, enterprise visibility now includes generative answer citations. Track the percentage of your core commercial queries triggering AI Overviews, and measure how frequently your brand domain is cited as a primary source within the generated summary.
To master competitor benchmarking and reverse-engineer your rivals’ organic market share, explore our field manual on SEO competitor analysis.
Tier 3: User Engagement & Funnel Velocity
Driving hundreds of thousands of organic visits creates zero enterprise value if readers bounce after three seconds. In modern SEO, user engagement serves two critical functions: it signals content satisfaction to Google’s ranking algorithms, and it advances prospects through the buyer’s journey into qualified sales leads:
1. Engaged Session Duration & Scroll Velocity:
Inside Google Analytics 4 (GA4), track Average Engagement Time on key editorial and service landing pages. For in-depth master guides and whitepapers, target engagement times exceeding 3.0 minutes and scroll depths >70%. Readers who spend three minutes deeply engaging with an article are 5x more likely to convert into active sales inquiries.
2. Multi-Touch Assisted Conversions:
In high-ticket B2B and enterprise sales, buyers rarely convert on their first website visit. An enterprise buyer might discover your company via an educational blog guide, return two weeks later to download a technical whitepaper, and finally book a sales demo after clicking a LinkedIn retargeting ad. If you only look at “last-click” attribution, paid ads get 100% of the credit, while the organic article that created the relationship gets zero. Track Assisted Conversions in GA4 and CRM pipeline reporting to prove SEO’s role in initiating and nurturing deals.
3. Organic Lead Capture Rate (MQLs):
Track the conversion rate of organic blog visitors into top-of-funnel and mid-funnel Marketing Qualified Leads (MQLs)—such as downloading enterprise research reports, registering for industry webinars, or utilizing free calculators. A high-performing enterprise content program maintains an organic lead capture rate between 1.5% and 3.5%.
4. Direct High-Intent Sales Inquiries:
Monitor direct commercial conversion actions originating from organic search, such as enterprise demo requests, RFP submissions, and phone calls. Tracking form completions across your core service pages confirms that your search strategy is attracting ready-to-buy decision-makers rather than casual information-seekers.
To align your editorial strategy with buyer intent, read our master guide on strategic content marketing services.
Multi-Touch Attribution Models for Enterprise SEO
One of the primary reasons search budgets get unfairly slashed is the misuse of simplistic attribution models. Depending on your organization’s sales cycle length, deploy one of these proven multi-touch models inside your CRM:
| Attribution Model | Credit Distribution | Best Fit Use Case | Impact on SEO Evaluation |
|---|---|---|---|
| Last-Touch (Flawed) | 100% to final conversion touchpoint | Transactional eCommerce with 1-day sales cycles | Under-reports SEO by 60%–80% |
| First-Touch | 100% to original discovery touchpoint | Brand awareness & demand-generation evaluation | Highlights SEO’s role in net-new pipeline origination |
| W-Shaped (Recommended) | 40% First Touch, 40% Lead Creation, 20% Opp Creation | B2B Enterprise SaaS & High-Ticket Services (90+ day cycles) | Balanced & highly accurate multi-touch view |
| Time-Decay | Increasing credit given to touches closer to close | Mid-length sales cycles with aggressive sales nurturing | Credits SEO content used in active sales enablement |
By adopting a W-shaped multi-touch attribution model, your marketing team can accurately prove that top-of-funnel educational search guides originated 40% of the enterprise deals closed by your outbound sales team.
Tier 4: The Executive Boardroom Metrics (Pipeline, CAC & ROI)
When presenting search marketing performance to the C-suite (CEO, CFO, CMO) and the Board of Directors, leave keyword rankings and crawl error logs off the presentation slides. Executives evaluate marketing investments through a financial lens. Focus your executive reporting on these four boardroom metrics:
1. Organic Sourced & Assisted Pipeline Value ($ ARR):
Connect Google Analytics 4 and Google Search Console directly with your enterprise CRM (such as Salesforce or HubSpot). Track the total dollar value of sales opportunities in your pipeline where organic search was either the first acquisition touchpoint (Organic Sourced) or an intermediate nurturing touchpoint (Organic Assisted). Proving that organic search generated $5 million in qualified pipeline immediately justifies marketing budget allocations.
2. Customer Acquisition Cost (CAC) Payback Period Compression:
Paid digital advertising (Google Ads, LinkedIn Sponsored Content) has an immediate marginal cost: every click costs money, and the moment you reduce ad spend, lead volume drops to zero. Conversely, high-ranking organic content continues to generate qualified prospects month after month with zero incremental media cost. Track how the compounding growth of organic customer acquisition reduces your blended company-wide CAC and compresses your CAC payback period (e.g., from 14 months down to 8 months).
3. Closed-Won Organic Revenue:
Measure the audited annual recurring revenue (ARR) or gross transaction volume generated from deals that originated through organic search. Calculate your exact enterprise SEO ROI using the standard executive formula:
Where total program cost includes agency retainers, internal SEO headcount, software licenses, and content production costs. When an enterprise SEO program yields a verified 400%+ ROI, executive leadership will eagerly approve continued expansion.
4. Compounding Organic Asset Lifetime Value (LTV):
An enterprise blog guide or technical tool published today remains active on your domain for three to five years. Unlike paid ads that disappear when budget expires, authoritative SEO assets appreciate in value as they earn backlinks and expand their keyword footprint. Model the multi-year customer lifetime value generated by evergreen organic assets to demonstrate long-term balance sheet equity.
To calculate your projected organic revenue lift and model customer acquisition payback, explore our free interactive Enterprise SEO ROI Calculator.
How to Build an Executive SEO Reporting Dashboard in 5 Steps
To eliminate manual spreadsheet reporting and provide real-time visibility across your organization, execute this five-step dashboard architecture workflow:
Step 1: Enforce Strict Data Hygiene & Brand Filtering:
Before building reports, clean your raw data. Filter out internal company IP addresses, block automated spam bots, and create regex filters in Google Search Console to permanently separate branded searches (containing your company name or trademarked products) from non-brand commercial searches.
Step 2: Stream Data to Cloud Warehousing (BigQuery):
Google Search Console UI limits historical data to 16 months and caps exports at 1,000 rows. Set up an automated BigQuery bulk data export from Search Console. This preserves years of historical search query telemetry, allowing your data team to run deep trend analyses without row limits.
Step 3: Connect CRM Pipeline Telemetry (HubSpot / Salesforce):
Ensure your website forms capture UTM parameters, first-touch referral channels, and Google Analytics Client IDs. Pass these data points into your CRM as hidden form fields. This links an inbound contact record directly to the organic blog post or service page that initiated their journey.
Step 4: Build a Role-Calibrated Looker Studio Dashboard:
Create a centralized Looker Studio or Power BI dashboard with three distinct tabs matching your reporting audiences:
- Tab 1 (Executive Summary): Total Organic Pipeline ($), Closed-Won ARR, Blended CAC, and Share of Voice vs. Competitors.
- Tab 2 (Marketing & Content): Non-brand clicks, top-converting blog categories, MQL capture rate, and keyword migration velocity.
- Tab 3 (Engineering & Technical): Indexation ratio, Core Web Vitals pass rates, server crawl errors, and page speed diagnostics.
Step 5: Establish a Consistent Monthly Executive Review Rhythm:
Automate a monthly email digest delivering a one-page PDF executive summary to leadership. Highlight three elements: (1) Bottom-line pipeline and revenue contribution, (2) Strategic market share gains against named rivals, and (3) Concrete action items planned for the upcoming sprint.
To understand the core algorithmic signals that govern Google search visibility, review our definitive master guide on important SEO ranking factors.
The Enterprise Reporting Cadence: Weekly, Monthly & Quarterly Templates
To establish institutional trust and keep every department aligned, structure your ongoing enterprise SEO reporting into three distinct operational rhythms:
1. The Weekly Technical Health Standup (Engineering & SEO Ops):
The weekly cadence is purely diagnostic. Its purpose is to catch code regressions, CDN caching errors, and crawl anomalies before they damage search visibility. The deliverable is a 5-bullet update in your team’s Slack or Microsoft Teams channel:
- Indexation Parity: Number of newly published URLs successfully indexed vs. dropped.
- Server Error Telemetry: Spikes in 404, 500, or 503 HTTP status codes from Googlebot server logs.
- Core Web Vitals Field Health: Any sudden regressions in 75th percentile LCP or INP following recent code deployments.
- Robots.txt & Sitemap Status: Verification that deployment staging rules did not accidentally push noindex directives to production.
2. The Monthly Tactical Growth Review (Marketing Leadership & Content Teams):
The monthly review focuses on commercial momentum and mid-funnel velocity. It is presented to the VP of Marketing, Content Directors, and Product Marketing leads via a concise 3-page Looker Studio dashboard:
- Non-Brand Search Inflow: Net growth in unique organic visits from non-branded commercial search queries.
- Top-3 Keyword Migrations: Number of high-intent search terms that successfully entered positions #1 through #3.
- Content Cluster Performance: Which editorial topic silos generated the highest volume of engaged reading time and assisted demo requests.
- Conversion Lead Velocity: Total organic Marketing Qualified Leads (MQLs) generated against the monthly pipeline quota.
3. The Quarterly Executive Briefing (C-Suite, CFO & Board of Directors):
The quarterly briefing is designed exclusively for the C-suite and Board. It contains zero technical search jargon and focuses 100% on financial return, competitive market share, and enterprise capital efficiency:
- Organic Sourced & Assisted Pipeline ARR: The total dollar value of active CRM deals initiated or influenced by organic search.
- Blended CAC Payback Compression: How the growth of organic acquisition reduced overall customer acquisition payback time.
- Competitive Share of Voice (SoV): Relative market share gains or losses against named corporate rivals across core commercial search clusters.
- Capital Efficiency & Program ROI: Net profit generated per dollar invested in agency retainers, tooling, and content production.
6 Costly Enterprise SEO Reporting Mistakes to Avoid
Protect your credibility with senior leadership by steering clear of these six common enterprise reporting traps:
1. Presenting Technical Jargon in Board Meetings:
Board members and CFOs do not want to hear about canonical tags, XML sitemap namespaces, or robots.txt directives. Frame every technical initiative around risk mitigation and revenue capacity (e.g., “Resolving server crawl errors will allow Google to index 15,000 unranked product pages, capturing an estimated $1.2M in annual organic demand”).
2. Lumping Brand and Non-Brand Traffic Together:
Reporting a 20% organic traffic increase without explaining that 90% came from people searching your company name hides the fact that your non-brand commercial acquisition may be stagnating. Always isolate non-brand traffic.
3. Relying Strictly on Last-Touch Attribution:
In multi-month B2B enterprise sales cycles, last-touch attribution credits whatever link the prospect clicked immediately before filling out a demo form. This systematically undervalues the top-of-funnel educational guides that introduced the prospect to your brand in the first place.
4. Celebrating Vanity Rankings for Low-Intent Keywords:
Ranking #1 for a high-volume informational term that attracts college students doing research produces great traffic charts, but zero pipeline. Prioritize tracking commercial keywords that indicate immediate purchasing intent.
5. Failing to Benchmark Against Direct Competitors:
Achieving 10% organic growth sounds impressive in isolation—until you realize your top two competitors grew by 45% over the same period. Always report Share of Voice relative to market rivals.
6. Treating Traffic Volume as Equal to Business Value:
1,000 visits to an enterprise pricing or solutions page is worth exponentially more than 50,000 visits to a generic lifestyle blog post. Weight your analytics reporting by page commercial value.
To learn how holistic search strategy accelerates enterprise customer acquisition, explore our complete suite of search engine optimization services.